As I read Corey Hart’s blog post about Phoenix real estate values and the wacky statistical report posted on Trulia, I started to hear news reports just released about the Washington DC regional real estate market.
To dig a little deeper, I looked at a subscription service called RBI which is produced by a division of MRIS. They generate better stats because they have more quality control of their data. Their QC finds the garbage stats, fixes ’em, so their results are accurate. I have seen a very active market in McLean and Oakton, and my associates in Silver Spring and College Park tell me their market has been hot too.
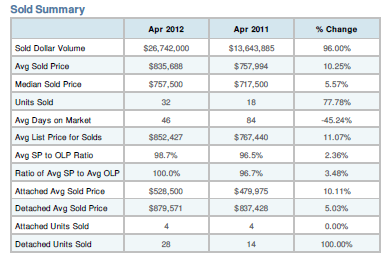
The Vienna real estate market has been busy recently so I thought that I would use RBI to drill down on one zip code, 22182, and see what the stats revealed. I do this realtor thing full time… but these numbers surprised me.
A 10.25% price gain in one year
Comparing year-on-year numbers is always interesting, but to have increases that leap as much as these can cause heart palpitations if you are a future home buyer looking for a home in this zip code. The number of sales is up 100%, and the average sold price is up 10%. Wow!
It is important to note that, in this zip code, any new home that was built in the past two years has sold above $1.2 million. Many of those homes replaced an older home so the net inventory of homes has remained close to the same. It is this limited supply, continued job growth in the local economy, and the fact interest rates are about 1% lower that has helped fuel prices of the existing inventory.
The following chart looks at the last two years, and note that the trend of “sold’ homes rises as it hits May and June. Expect to see the same trend this May and June.
The chart above will change every month as RBI publishes their data so plan to revisit this page in early June or July.
Although I can generate charts for any zip code to get that extra local read on real estate activity, I clearly remember my statistics professor at Boston University showing us many ways to interpret statistics. Yes, all of those economists will use them to draw conclusions to validate their points. What I see here is a real estate market under considerable inventory pressure in a very desirable place to live. The problem: it’s expensive to buy a home in the Washington DC area!
Do you want really geeky real estate statistics?
If you are really interested in geeky real estate analysis, forget referencing Trulia or Zillow and read reports from George Mason University’s Center for Regional Analysis where the PhD’s publish their data.


